Annual Investment Report – 2025
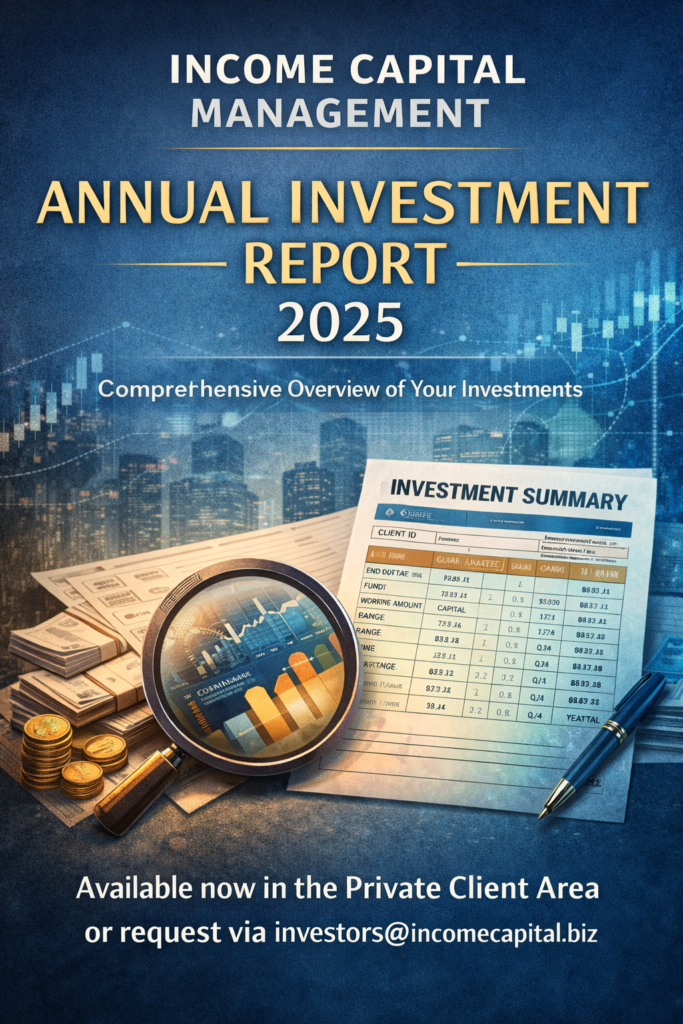
Annual Investment Report – 2025 INCOME CAPITAL MANAGEMENT informs all clients that the Annual Investment Report for the year 2025 is available for consultation and printing directly from the Private Client Area. Within the dedicated investment section, each client can view a comprehensive overview of their positions, including performance data, invested capital, and operational configurations, with information updated according to the reporting frequency applicable to each fund. Formal Annual Report Request Clients who wish to receive the official Annual Investment Report for 2025, formally issued by Income Capital Management s.r.o., are kindly requested to submit their request by email to: 📧 investors@incomecapital.biz Please ensure that the email includes the relevant Client ID (or Client IDs, in the case of multiple investments) for which the report is requested. The document will be prepared and delivered in accordance with internal verification and compliance procedures. Return Update Frequency Investment returns displayed on the investment page are updated according to the following schedule: Weekly for the FOREX FUND Monthly for all other funds (typically by the 4th day of the following month) If an investment did not start at the beginning of a standard quarter (January, April, July, October), returns are calculated and displayed on a pro-rata basis. Explanation of Table Fields Below is a description of the main fields displayed in the investment summary table: CLIENT ID: The client identification number assigned by Income Capital Management s.r.o. Clients with multiple investments will have multiple Client IDs. END DATE: The maturity or expiration date of the investment. FUND: The type of investment subscribed. GUARANTEED CAPITAL: The percentage of capital guaranteed, where applicable. WORKING AMOUNT: The operating capital on which returns are calculated. This amount does not include any reinvested profits. RANGE: The indicative annual return range, reflecting the risk level of the selected investment. Q1, Q2, Q3, Q4: Percentage and monetary value of any profit generated in the respective quarter, if applicable. YEARLY TOTAL: Total annual profit expressed as both a percentage and an amount in EUR. For clients who do not reinvest profits quarterly, this figure is shown only for the current quarter. CAPITAL + INVESTMENT: The total amount in EUR consisting of invested capital plus any profits generated during the year. REINVESTED PROFITS ON QUARTERLY BASIS: Indicates whether quarterly profit reinvestment has been selected. PAC AMOUNT ON QUARTERLY BASIS: Indicates whether a quarterly Capital Accumulation Plan (PAC) is active and the selected contribution amount. Support and Clarifications The team at INCOME CAPITAL MANAGEMENT remains fully available for any clarification or additional information regarding the annual report, investment data, or portfolio configurations. Kind regards, INCOME CAPITAL MANAGEMENT s.r.o.
Investment Returns: €10,000 Then vs Now — A 10-Year Comparison
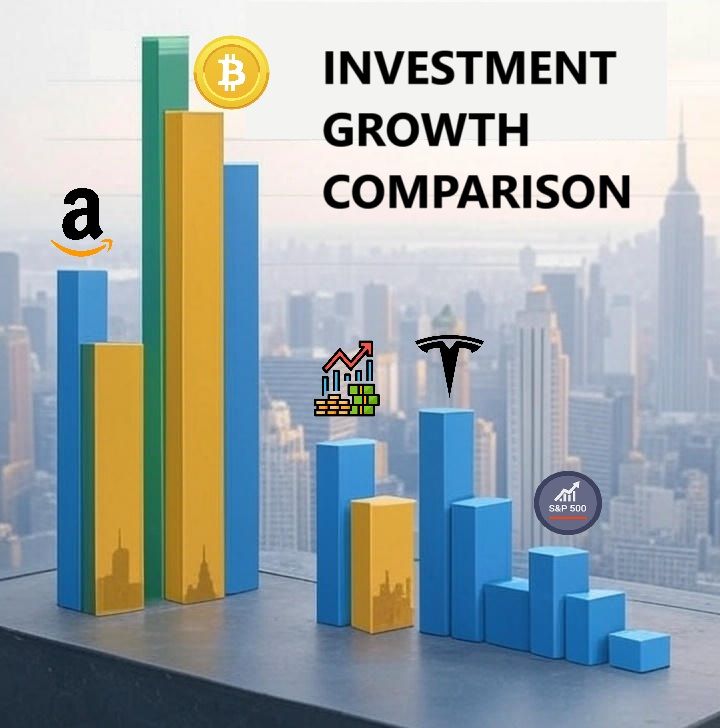
Investment Returns: €10,000 Then vs Now — A 10-Year Comparison Time is one of the most powerful variables in investing. Looking back over the past decade, the difference between asset classes becomes striking when performance is measured over a full market cycle rather than short-term movements. This analysis addresses a simple but fundamental question: What would €10,000 invested ten years ago be worth today? The comparison below highlights how different assets have behaved over time, illustrating the impact of growth, volatility, and risk management. Stock Market Indices Equity markets delivered solid long-term growth, with notable differences between regions. NASDAQ Composite: approximately +261% over 10 years S&P 500: approximately +170% over 10 years FTSE 100 (London): approximately +45% over 10 years FTSE MIB (Milan): approximately +50% over 10 years The data confirms the structural outperformance of U.S. markets, largely driven by technology and innovation-led growth. Individual Stocks Selecting individual equities amplified returns significantly, while also increasing volatility and concentration risk. Amazon: approximately +1,561% over 10 years Apple: approximately +1,193% over 10 years Microsoft: approximately +1,334% over 10 years Alphabet (Google): approximately +872% over 10 years Tesla: approximately +13,895% over 10 years These outcomes highlight the power of innovation — and the importance of managing downside risk when exposure is concentrated. Bitcoin Bitcoin represents the most extreme example of asymmetric risk and return. Bitcoin: approximately +39,800% over 10 years Such performance came with extreme volatility, sharp drawdowns, and regulatory uncertainty — factors that require careful sizing within a diversified portfolio. Gold Gold continued to serve as a long-term store of value and defensive asset. Gold: approximately +126% total return over 10 years While returns were lower than equities, gold provided stability during periods of inflation and market stress. Real Estate (Value Appreciation) Property markets delivered mixed results depending on geography and local fundamentals. New York: approximately +35% over 10 years London: approximately +40% over 10 years Milan: approximately +25% over 10 years Dubai: approximately +90% over 10 years Dubai stands out for its strong appreciation, supported by international capital flows and favorable economic policies. The Income Capital Forex Fund Perspective Based on historical assumptions, a €10,000 investment in the Income Capital Forex Fund over the same ten-year horizon would have generated approximately +500%. This performance would place the strategy: Above traditional equity indices Well ahead of gold and most real estate markets Below high-volatility assets such as Bitcoin The differentiating factor remains a disciplined framework combining active management, structured risk control, and consistent execution. Key Takeaways High Risk, High Reward: Crypto and select equities delivered exceptional returns, but with extreme volatility. Technology Leadership: Innovation-driven companies reshaped long-term equity performance. Stability vs Growth: Gold and real estate offered resilience rather than explosive growth. Diversification Matters: Balanced portfolios reduce volatility while preserving long-term opportunity. Final Consideration Investment success is not about chasing the best-performing asset, but about constructing a portfolio that aligns risk, time horizon, and objectives. Consistency, diversification, and discipline remain the foundations of long-term capital growth. Original LinkedIn post: View the discussion on LinkedIn