Reading Central Banks: A Practical Guide for Investors | Income Capital Management

Reading Central Banks: A Practical Guide for Investors By Nicola Pinchi — Income Capital Management Few forces in global finance move markets as consistently and as broadly as central bank decisions. A single press conference from the Federal Reserve, the European Central Bank, or the Bank of England can reprice bonds across the entire yield curve, send currencies surging or sliding, trigger equity rotations worth hundreds of billions, and shift the risk appetite of institutional investors worldwide — all within the span of a few hours. And yet, for most investors, central bank communication remains one of the most frustrating aspects of financial markets to navigate. The language is deliberately cautious, laden with caveats, and often designed as much to manage market expectations as to convey actual policy intent. After each meeting, headlines compete to offer the definitive interpretation, analysts disagree on the implications, and investors are left wondering what — if anything — they should actually do. At Income Capital Management, we believe the answer is not to react faster to central bank announcements. It is to understand which signals genuinely matter — and to build that understanding into strategic decisions long before the next meeting takes place. Why Monetary Policy for Investors Cannot Be Ignored The influence of central banks on investment portfolios is not a recent phenomenon, but it has become more pronounced in the past two decades. Since the 2008 financial crisis, central bank policy has been the dominant driver of asset valuations across virtually every major market. Ultra-low interest rates and quantitative easing programmes inflated bond prices, compressed credit spreads, boosted equity multiples, and sent real estate values to historic highs. When that cycle eventually reversed — as it did sharply from 2022 onwards — the damage across asset classes was equally broad. Understanding the direction of monetary policy is therefore not an academic exercise for macroeconomists. It is a practical necessity for anyone managing a diversified portfolio. Whether you hold bonds, equities, currency positions, or real assets, the path of interest rates and central bank liquidity conditions will influence your returns, your risk profile, and your optimal asset allocation in ways that no bottom-up analysis of individual securities can fully compensate for. The challenge is not recognising this fact. The challenge is developing a systematic, repeatable framework for extracting actionable insight from the noise of central bank communication — without getting lost in every nuance of every statement. The Four Signals That Actually Matter Over years of integrating monetary policy analysis into portfolio management across Forex, High Yield, Global Growth and Real Estate, we have found that four signals consistently carry the most predictive weight. Everything else is largely commentary. Inflation trends are the bedrock. Central banks exist primarily to manage price stability, and their policy decisions are ultimately a response to what inflation is doing and where it is expected to go. When inflation is rising above target, the policy bias will lean restrictive — higher rates, tighter liquidity conditions, a headwind for duration-sensitive assets. When inflation is falling towards or below target, the bias shifts accommodative. Tracking the evolution of core inflation, services inflation, and inflation expectations — rather than headline CPI alone — gives a far more reliable read on the direction of travel than any central bank statement. Policy direction and pace matter as much as the absolute level of rates. Markets do not reprice because rates are high or low in absolute terms; they reprice when the direction or pace of change surprises. A central bank that signals it is done hiking — even at elevated rates — is providing a very different environment for risk assets than one that is actively tightening. Learning to identify genuine policy pivots, as distinct from tactical pauses or communication management, is one of the most valuable skills a macro-aware investor can develop. Liquidity conditions are the transmission mechanism that connects monetary policy to real market behaviour. Beyond the policy rate itself, the size and composition of central bank balance sheets, the pace of quantitative tightening or easing, and the functioning of repo and money markets all determine how easily credit flows through the financial system. Periods of ample liquidity tend to compress risk premiums and support asset prices. Periods of tightening liquidity have the opposite effect — often before the impact shows up in economic data. Monitoring these conditions provides an early warning system that pure rate analysis misses. Central bank credibility is the most intangible of the four signals, but ultimately the most powerful. A central bank that the market believes will do what it says — that has a track record of hitting its inflation target, communicating consistently, and following through on its commitments — has enormous capacity to stabilise expectations without dramatic policy action. A central bank that has lost credibility, or that sends confused signals, generates persistent uncertainty that increases volatility across all asset classes. Assessing credibility requires a qualitative overlay on top of quantitative data, but it is essential to getting the framework right. From Analysis to Portfolio Decisions Understanding these four signals is necessary. Knowing how to translate them into portfolio positioning is what makes the analysis useful. In our Forex strategies, monetary policy divergence between central banks is the primary driver of medium-term currency moves. When the Fed is tightening while the ECB is on hold, or when the Bank of Japan is normalising while the Bank of England is cutting, these differentials create directional Forex opportunities that can be captured systematically. The key is distinguishing between divergences that are already priced in and those that the market has not yet fully discounted. In our High Yield credit allocations, the liquidity cycle is particularly critical. Loose monetary conditions compress spreads and reduce default risk by making refinancing easier for leveraged borrowers. Tightening conditions have the opposite effect: spreads widen, refinancing becomes more expensive, and the weakest credits face genuine stress. Mapping the liquidity cycle allows us to adjust credit quality and duration positioning well
Investment Returns: €10,000 Then vs Now — A 10-Year Comparison
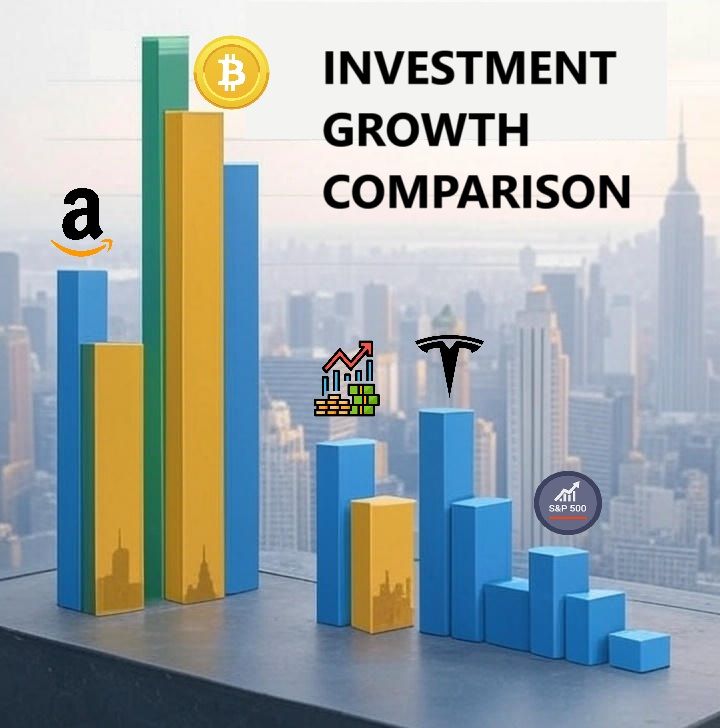
Investment Returns: €10,000 Then vs Now — A 10-Year Comparison Time is one of the most powerful variables in investing. Looking back over the past decade, the difference between asset classes becomes striking when performance is measured over a full market cycle rather than short-term movements. This analysis addresses a simple but fundamental question: What would €10,000 invested ten years ago be worth today? The comparison below highlights how different assets have behaved over time, illustrating the impact of growth, volatility, and risk management. Stock Market Indices Equity markets delivered solid long-term growth, with notable differences between regions. NASDAQ Composite: approximately +261% over 10 years S&P 500: approximately +170% over 10 years FTSE 100 (London): approximately +45% over 10 years FTSE MIB (Milan): approximately +50% over 10 years The data confirms the structural outperformance of U.S. markets, largely driven by technology and innovation-led growth. Individual Stocks Selecting individual equities amplified returns significantly, while also increasing volatility and concentration risk. Amazon: approximately +1,561% over 10 years Apple: approximately +1,193% over 10 years Microsoft: approximately +1,334% over 10 years Alphabet (Google): approximately +872% over 10 years Tesla: approximately +13,895% over 10 years These outcomes highlight the power of innovation — and the importance of managing downside risk when exposure is concentrated. Bitcoin Bitcoin represents the most extreme example of asymmetric risk and return. Bitcoin: approximately +39,800% over 10 years Such performance came with extreme volatility, sharp drawdowns, and regulatory uncertainty — factors that require careful sizing within a diversified portfolio. Gold Gold continued to serve as a long-term store of value and defensive asset. Gold: approximately +126% total return over 10 years While returns were lower than equities, gold provided stability during periods of inflation and market stress. Real Estate (Value Appreciation) Property markets delivered mixed results depending on geography and local fundamentals. New York: approximately +35% over 10 years London: approximately +40% over 10 years Milan: approximately +25% over 10 years Dubai: approximately +90% over 10 years Dubai stands out for its strong appreciation, supported by international capital flows and favorable economic policies. The Income Capital Forex Fund Perspective Based on historical assumptions, a €10,000 investment in the Income Capital Forex Fund over the same ten-year horizon would have generated approximately +500%. This performance would place the strategy: Above traditional equity indices Well ahead of gold and most real estate markets Below high-volatility assets such as Bitcoin The differentiating factor remains a disciplined framework combining active management, structured risk control, and consistent execution. Key Takeaways High Risk, High Reward: Crypto and select equities delivered exceptional returns, but with extreme volatility. Technology Leadership: Innovation-driven companies reshaped long-term equity performance. Stability vs Growth: Gold and real estate offered resilience rather than explosive growth. Diversification Matters: Balanced portfolios reduce volatility while preserving long-term opportunity. Final Consideration Investment success is not about chasing the best-performing asset, but about constructing a portfolio that aligns risk, time horizon, and objectives. Consistency, diversification, and discipline remain the foundations of long-term capital growth. Original LinkedIn post: View the discussion on LinkedIn